Pathways provides you with detailed usage data showing how prospective students are using Pathways in your website. In a recent conversation with a college, they asked whether there was a higher level view of this data that could be exported to PDF. So we made it happen.
It has always been important that colleges can see how people are using and interacting with Pathways on their website. To confirm its value and to show what jobs and progression options are most common for particular courses.
We have always made analytics usage data available for every page on which you’ve embedded Pathways, to gain an understanding of what people are looking at.
A higher level view
Whilst the detailed usage data is very informative, it can take a while to work through and look at the details for each course. And it was a recent conversation with a Pathways client that reiterated this point.
They asked if we had a higher level view of the data, where they could export a top-level report that demonstrated Pathways as an effective engagement tool.
All of the data available was stored and mapped correctly, it was a case of turning this into a high-level view where key metrics were easy to understand at a glance. And where this report could be downloaded as a PDF to share with colleagues and managers.
A new dashboard
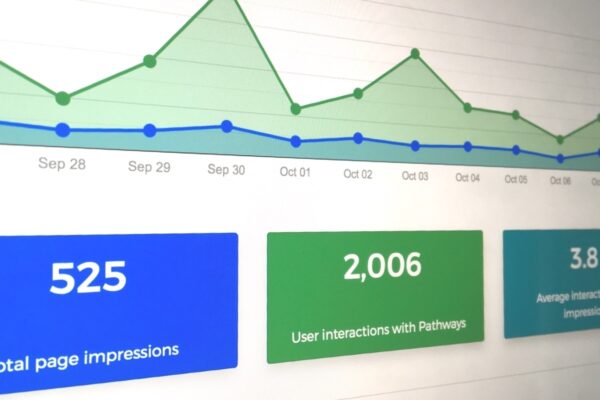
This week we have released a new Analytics Dashboard that sits at the front of your Analytics section. It gives high level numbers across all of the places where you’ve embedded Pathways for the time frame you specify.
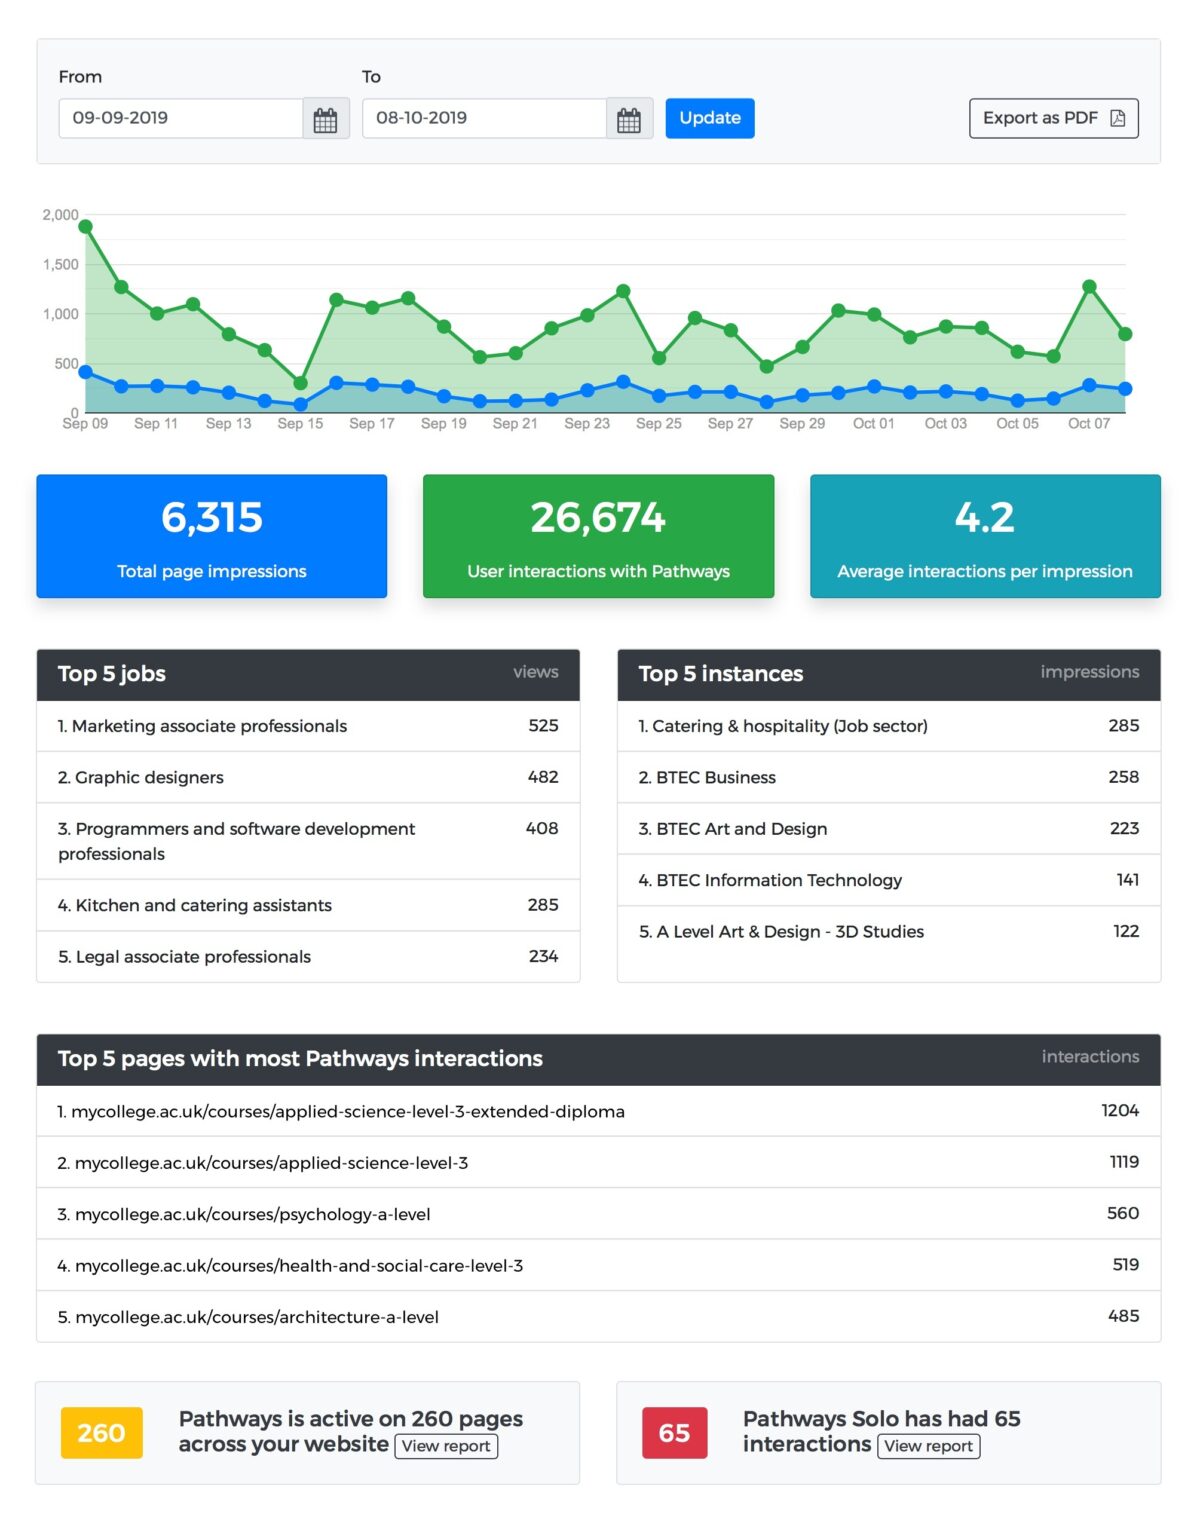
The new dashboard displays data for:
- Total page impressions
- User interactions with Pathways
- Average interactions per impression
- Top 5 jobs
- Top 5 instances
- Top 5 pages with most interactions
- The total number of pages on which Pathways is active with a link to the full report
- Number of interactions for Pathways Solo with a link to the report
This report can also be exported as a PDF.
You can still drill down to see page specific usage data as before, so if you liked seeing the additional detail this is still accessible.
Your feedback is important
We are always very keen to hear from you. To understand how you’re using Pathways and if you feel we could add anything to improve the process, your experience, or if there’s a specific feature you think it’s missing!
With the addition of this feature, along with previous additions, hopefully it’s to clear to see that we’re always listening!